Wednesday, 19 June 2019

WHAT IS HISTOGRAM?

histogram is an accurate representation of the distribution of numerical data. It is an estimate of the probability distribution of a continuous variableIt differs from a bar graph, in the sense that a bar graph relates two variables, but a histogram relates only one. 
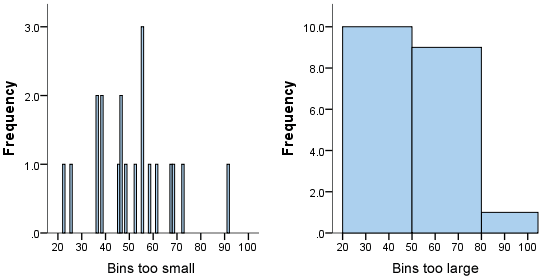
To construct a histogram, the first step is to "bin" (Data interval) the range of values that is, divide the entire range of values into a series of intervals and then count how many values fall into each interval. The bins are usually specified as consecutive, non-overlapping intervals of a variable. The bins (intervals) must be adjacent, and are often (but are not required to be) of equal size


 OR

A histogram is a display of statistical information that uses rectangles to show the frequency of data items in successive numerical intervals of equal size. In the most common form of histogram, the independent variable is plotted along the horizontal axis and the dependent variable is plotted along the vertical axis. The data appears as colored or shaded rectangles of variable area.


Ni namna ya kuwakilisha data kitakwimu. Data hizi zinakuwa zimewekwa katika makundi yanayo fuatana bila kuruka hata kundi moja. KWA MFANO HIZI hapa chini  NI DATA


25,22
36,38,36,38
46,45,48,46
55,55,52,58,55
68,67,61,72 and 91

zikipangwa katika makundi yanofuatana zitakuwa hivi

20-30   kuna data 2 ambazo zipo kundi hili          

30-40 kuna data 4 ambazo zipo kundi hili            

40-50   kuna data 4 ambazo zipo kundi hili         

50-60  kuna data 5 ambazo zipo kundi hili        

60-70  kuna data 3 ambazo zipo kundi hili         

70-80   kuna data 1 ambazo zipo kundi hili       

80-90 kuna data 0 ambazo zipo kundi hili   
        
90-100 kuna data 1 ambazo zipo kundi hili 
 na kama utajumlisha idadi ya data kwa kila kundi basi utapa jumla sawa na data ulizo nazo.  = 2+4+4+5+3+1+0+1       


jumla ni 20, na haya makundi yanafuatana bila kuacha hata namba moja na yana tofauti zinazofanana(maandishi mekundu mwanzo mwa page.)


BAADAYE GRAPH ITACHORWA IKIZINGATIA KUNDI NA IDADI YA DATA ZILIZO ANGUKIA KUNDI HILO. HORIZONTAL AXIS DATA INTERVAL-BIN VERTICAL AXIS IDADI YA HIZO NAMBA


Sunday, 2 June 2019

COMPUTER KEYBOARD SHORTCUTS.


Ctrl + A - Select All
Ctrl + B - Bold
Ctrl + C - Copy
Ctrl + D - Fill
Ctrl + F - Find
Ctrl + G - Find next instance of text
Ctrl + H - Replace
Ctrl + I - Italic
Ctrl + K - Insert a hyperlink
Ctrl + N - New workbook
Ctrl + O - Open
Ctrl + P - Print
Ctrl + R - Nothing right
Ctrl + S - Save
Ctrl + U - Underlined
Ctrl + V - Paste
Ctrl W - Close
Ctrl + X - Cut
Ctrl + Y - Repeat
Ctrl + Z - Cancel
F1 - Help
F2 - Edition
F3 - Paste the name
F4 - Repeat the last action
F4 - When entering a formula, switch between absolute / relative references
F5 - Goto
F6 - Next Pane
F7 - Spell Check
F8 - Extension of the mode
F9 - Recalculate all workbooks
F10 - Activate Menubar
F11 - New graph
F12 - Save As
Ctrl +: - Insert the current time
Ctrl +; - Insert the current date
Ctrl + "- Copy the value of the cell above
Ctrl + '- Copy the formula from the cell above
Shift - Offset Adjustment for Additional Functions in the Excel Menu
Shift + F1 - What is it?
Shift + F2 - Edit cell comment
Shift + F3 - Paste the function into the formula
Shift + F4 - Search Next
Shift + F5 - Find
Shift + F6 - Previous Panel
Shift + F8 - Add to the selection
Shift + F9 - Calculate the active worksheet
Shift + F10 - Popup menu display
Shift + F11 - New spreadsheet
Shift + F12 - Save
Ctrl + F3 - Set name
Ctrl + F4 - Close
Ctrl + F5 - XL, size of the restore window
Ctrl + F6 - Next Workbook Window
Shift + Ctrl + F6 - Previous Workbook Window
Ctrl + F7 - Move window
Ctrl + F8 - Resize Window
Ctrl + F9 - Minimize the workbook
Ctrl + F10 - Maximize or Restore Window
Ctrl + F11 - Inset 4.0 Macro sheet
Ctrl + F1 - Open File
Alt + F1 - Insert a graph
Alt + F2 - Save As
Alt + F4 - Output
Alt + F8 - Macro dialog
Alt + F11 - Visual Basic Editor
Ctrl + Shift + F3 - Create a name using the names of row and column labels
Ctrl + Shift + F6 - Previous Window
Ctrl + Shift + F12 - Printing
Alt + Shift + F1 - New spreadsheet
Alt + Shift + F2 - Save
Alt + = - AutoSum
Ctrl + `- Toggle value / display of the formula
Ctrl + Shift + A - Insert the argument names in the formula
Alt + down arrow - automatic view list
Alt + '- Format Style Dialog
Ctrl + Shift + ~ - General Format

MATOKEO YA AWALI ENTERPRENEURSHIP LEVEL 6-2. KUNA AMBAO KATI ONE ITARUDI ILE YA MWANZO.

TABORA POLYTECHNIC COLLEGE PHARMACEUTICAL SCIENCES DEPARTMENT EXAMINATION NUMBER  NTA LEVEL 6...