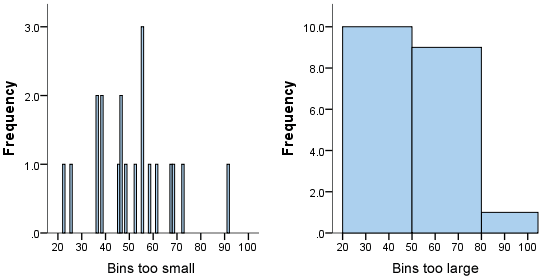
To construct a histogram, the first step is to "bin" (Data interval) the range of values that is, divide the entire range of values into a series of intervals and then count how many values fall into each interval. The bins are usually specified as consecutive, non-overlapping intervals of a variable. The bins (intervals) must be adjacent, and are often (but are not required to be) of equal size
OR
A histogram is a display of statistical information that uses rectangles to show the frequency of data items in successive numerical intervals of equal size. In the most common form of histogram, the independent variable is plotted along the horizontal axis and the dependent variable is plotted along the vertical axis. The data appears as colored or shaded rectangles of variable area.
Ni namna ya kuwakilisha data kitakwimu. Data hizi zinakuwa zimewekwa katika makundi yanayo fuatana bila kuruka hata kundi moja. KWA MFANO HIZI hapa chini NI DATA
25,22
36,38,36,38
46,45,48,46
55,55,52,58,55
68,67,61,72 and 91
zikipangwa katika makundi yanofuatana zitakuwa hivi
20-30 kuna data 2 ambazo zipo kundi hili
30-40 kuna data 4 ambazo zipo kundi hili
40-50 kuna data 4 ambazo zipo kundi hili
50-60 kuna data 5 ambazo zipo kundi hili
60-70 kuna data 3 ambazo zipo kundi hili
70-80 kuna data 1 ambazo zipo kundi hili
80-90 kuna data 0 ambazo zipo kundi hili
90-100 kuna data 1 ambazo zipo kundi hili
na kama utajumlisha idadi ya data kwa kila kundi basi utapa jumla sawa na data ulizo nazo. = 2+4+4+5+3+1+0+1
|
BAADAYE GRAPH ITACHORWA IKIZINGATIA KUNDI NA IDADI YA DATA ZILIZO ANGUKIA KUNDI HILO. HORIZONTAL AXIS DATA INTERVAL-BIN VERTICAL AXIS IDADI YA HIZO NAMBA


No comments:
Post a Comment